Running a successful medical practice today requires more than clinical excellence. It demands smart business decisions backed by data. Medical practice analytics have become essential tools for clinic administrators and healthcare providers who want to optimize operations, improve patient care, and increase profitability.
At DigifyClinic, we work exclusively with doctors and healthcare brands to leverage digital marketing strategies that drive measurable results. Through our experience partnering with medical practices, we’ve identified the metrics that truly matter for clinic success.
Yet many small to mid-sized clinics still operate without tracking meaningful metrics. They make decisions based on intuition rather than information, potentially leaving revenue on the table and missing opportunities to enhance patient experiences.
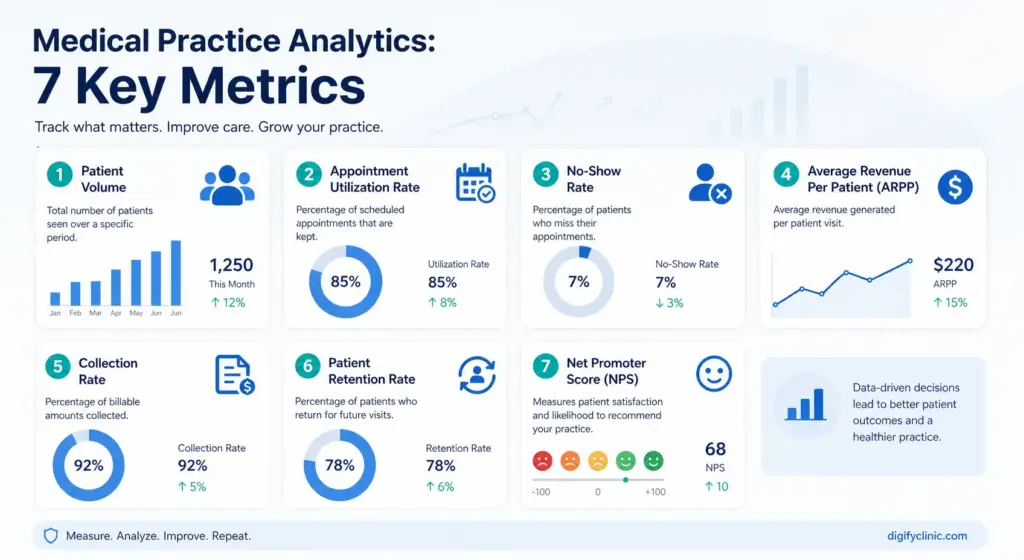
This comprehensive guide explores seven critical metrics that every modern clinic should monitor, why they matter, and how to use them to transform your practice’s performance.
Why Medical Practice Analytics Matter More Than Ever
The healthcare landscape has changed dramatically. Patients have more choices, insurance reimbursements grow increasingly complex, and operational costs continue rising. In this environment, gut feelings aren’t enough.
Data-driven decision-making helps you identify problems before they become crises, recognize growth opportunities, and allocate resources where they’ll have the greatest impact. Clinics using medical practice analytics consistently outperform those that don’t across multiple dimensions, from patient satisfaction to financial health.
Modern practice management systems make collecting and analyzing this data easier than ever. The challenge isn’t gathering information; it’s knowing which metrics truly matter and how to act on them. That’s where DigifyClinic’s expertise in healthcare digital marketing becomes invaluable. We help you not just track data, but transform it into growth strategies.
Metric 1: Patient Acquisition Cost (PAC)
What It Measures
Patient Acquisition Cost tells you exactly how much you spend to attract each new patient to your practice. Calculate it by dividing your total marketing and advertising expenses by the number of new patients acquired during the same period.
For example, if you spent $3,000 on marketing last month and gained 30 new patients, your PAC is $100 per patient.
Why It Matters
Understanding your acquisition cost helps you evaluate marketing effectiveness and make smarter budget decisions. If you’re spending $200 to acquire patients who generate only $150 in lifetime value, you have an unsustainable business model.
This metric also helps you compare different marketing channels. You might discover that social media advertising brings patients at $75 each while physician referrals cost just $25 when you factor in relationship-building expenses.
At DigifyClinic, we help healthcare brands optimize their patient acquisition strategies across digital channels from Google Ads to social media campaigns, ensuring every marketing dollar works harder for your practice.
How to Optimize
Track PAC separately for each marketing channel. Double down on the most cost-effective methods and reduce or eliminate poor performers. Remember that some channels may have higher acquisition costs but bring more valuable long-term patients.
Consider the quality alongside the cost. A patient who stays with your practice for years and refers others delivers far more value than one who visits once and disappears.
Implement tracking systems that attribute new patients to specific marketing efforts. This level of granularity reveals which campaigns truly drive growth versus those that simply consume budget.
Metric 2: Appointment No-Show Rate
What It Measures
Your no-show rate represents the percentage of scheduled appointments where patients fail to appear without canceling in advance. Calculate it by dividing no-shows by total scheduled appointments, then multiplying by 100.
A practice with 400 scheduled appointments and 40 no-shows has a 10% no-show rate.
Why It Matters
Every unfilled appointment slot represents lost revenue you can never recover. If your average appointment generates $200 in revenue and you have five no-shows weekly, you’re losing approximately $52,000 annually.
Beyond direct financial impact, no-shows disrupt schedules, frustrate staff, and prevent other patients from accessing care. High no-show rates often indicate deeper issues with patient engagement or appointment scheduling processes.
How to Optimize
Implement automated appointment reminders via text, email, and phone calls. Research shows multi-channel reminders can reduce no-shows by 20-40%.
Make rescheduling convenient through online portals and mobile apps. The easier you make it for patients to adjust appointments, the less likely they’ll simply not show up.
Consider implementing a reasonable cancellation policy. While you want to be patient-friendly, clearly communicated consequences can encourage better behavior.
Analyze patterns in your data. Do certain appointment types, times, or patient demographics have higher no-show rates? Targeted interventions work better than one-size-fits-all approaches.
DigifyClinic specializes in implementing patient communication systems that dramatically reduce no-show rates through strategic digital engagement, helping healthcare providers maximize schedule efficiency.
Metric 3: Patient Lifetime Value (PLV)
What It Measures
Patient Lifetime Value estimates the total revenue a patient will generate throughout their entire relationship with your practice. Calculate it by multiplying the average visit value by average annual visit frequency, then multiplying by the average number of years patients stay with your practice.
For instance, if patients average $150 per visit, visit three times yearly, and remain with your practice for five years, the PLV is $2,250.
Why It Matters
PLV fundamentally changes how you think about patient relationships and acquisition costs. When you know a new patient will likely generate $2,250 over their lifetime, spending $100 to acquire them becomes an obvious investment.
This metric also highlights the importance of patient retention. Increasing average patient tenure from five to six years increases lifetime value by 20% without acquiring a single new patient.
Understanding PLV helps you identify your most valuable patient segments. You might discover that pediatric patients have higher lifetime value than you realized because they visit frequently over many years, while certain specialty patients generate significant revenue but rarely return.
How to Optimize
Focus on retention strategies that keep patients engaged with your practice. Regular communication, excellent service, and convenient access all contribute to longer patient relationships.
Develop programs that encourage appropriate utilization. Preventive care reminders and follow-up appointment scheduling help patients get the care they need while increasing visit frequency.
Calculate PLV for different patient segments. This allows you to make informed decisions about where to focus acquisition efforts and which patients deserve extra retention attention.
Digital marketing strategies from DigifyClinic, including email nurture campaigns, patient education content, and engagement programs, help healthcare brands maximize patient lifetime value through consistent, valuable touchpoints.
Metric 4: Revenue Per Patient Visit
What It Measures
This straightforward metric divides your total revenue by total patient visits for a given period. It tells you how much revenue each patient encounter generates on average.
If your practice generated $120,000 from 800 patient visits last month, your revenue per visit is $150.
Why It Matters
Tracking revenue per visit helps you understand whether you’re capturing appropriate value for the services you provide. Declining numbers might indicate coding issues, insurance reimbursement problems, or changes in case mix.
This metric also helps you forecast revenue based on appointment volumes. If you know your revenue per visit and can predict monthly appointment numbers, you can project income with reasonable accuracy.
Comparing revenue per visit across providers in your practice can reveal training opportunities or scheduling inefficiencies. Significant variations might indicate that some providers need coding education or that certain providers are being scheduled with disproportionately complex or simple cases.
How to Optimize
Ensure proper coding and documentation for all services provided. Many practices leave money on the table by under-coding or failing to document services that were actually delivered.
Train front desk staff to verify insurance information before appointments. Insurance issues are a leading cause of claim denials and reduced reimbursement.
Consider ancillary revenue opportunities appropriate to your specialty. In-office procedures, diagnostic testing, or retail products can increase revenue per visit when they genuinely serve patient needs.
Review your fee schedule regularly. If you haven’t adjusted fees in years while costs have increased, your revenue per visit will decline in real terms.
Metric 5: Staff Productivity Ratios
What It Measures
Staff productivity metrics compare your workforce size to output measures like patient visits, revenue, or patients served. Common ratios include patients per full-time employee (FTE) or revenue per FTE.
Calculate patients per FTE by dividing total monthly patients by the number of full-time equivalent staff members. If you see 1,200 patients monthly with 10 FTE employees, your ratio is 120 patients per FTE.
Why It Matters
Personnel typically accounts for the largest expense category in medical practices, often consuming 50-60% of revenue. Understanding productivity helps you staff appropriately, avoiding both costly overstaffing and service-damaging understaffing.
These ratios provide benchmarks for comparison against industry standards and your own historical performance. Declining productivity might signal process inefficiencies, technology problems, or the need for training.
Productivity metrics also guide expansion decisions. If your ratios indicate you’re operating efficiently but still can’t meet patient demand, you likely need to add capacity by hiring additional staff or extending hours.
How to Optimize
Implement technology that reduces administrative burden. Electronic health records, automated appointment reminders, and online patient portals allow staff to focus on higher-value activities.
Standardize processes wherever possible. Documented workflows reduce variation, minimize errors, and help new staff become productive faster.
Cross-train team members to increase flexibility. When staff can perform multiple roles, you can better handle volume fluctuations and absences without compromising productivity.
Regularly review role descriptions and eliminate tasks that don’t add value. Many practices continue legacy processes long after they’ve become obsolete.
At DigifyClinic, we help doctors implement digital solutions that automate routine tasks, freeing your team to focus on patient care rather than administrative work, a key factor in improving productivity ratios.
Metric 6: Patient Satisfaction Scores (Net Promoter Score)
What It Measures
The Net Promoter Score (NPS) measures patient loyalty and satisfaction through a simple question: “How likely are you to recommend our practice to friends or family?” Patients respond on a 0-10 scale.
Calculate NPS by subtracting the percentage of detractors (scores 0-6) from the percentage of promoters (scores 9-10). Scores can range from -100 to +100, with anything above zero considered good and above 50 considered excellent.
Why It Matters
Patient satisfaction drives critical business outcomes. Satisfied patients keep appointments, follow treatment plans, refer others, and leave positive online reviews, all of which directly impact your bottom line.
NPS also serves as an early warning system. Declining scores alert you to problems before they significantly damage your practice’s reputation or patient base.
This metric correlates strongly with patient retention. Promoters stay with practices longer and generate higher lifetime value, while detractors often leave and may share negative experiences publicly.
For healthcare brands, online reputation is everything. DigifyClinic helps doctors leverage positive patient experiences into powerful marketing assets through review management and reputation-building strategies.
How to Optimize
Survey patients consistently, not just once. Regular measurement lets you track trends and measure the impact of improvement initiatives.
Close the feedback loop by responding to patient concerns. When patients see that their feedback drives meaningful changes, satisfaction improves, and survey response rates increase.
Focus on the patient experience holistically, not just clinical outcomes. Wait times, staff friendliness, facility cleanliness, and communication all significantly impact satisfaction scores.
Train all team members on patient experience principles. Every interaction shapes perception, from the initial phone call through checkout.
Leverage positive feedback in your marketing. With patient permission, testimonials and success stories become powerful tools for attracting new patients who value quality care.
Metric 7: Digital Engagement Rate
What It Measures
Digital engagement rate tracks how actively patients use your online tools like patient portals, appointment scheduling systems, and mobile apps. Calculate it by dividing active digital users by total patients.
If 600 of your 2,000 active patients used your patient portal last month, your digital engagement rate is 30%.
Why It Matters
Digital engagement reduces administrative workload while improving patient convenience. Patients who book appointments online, message with questions, and access test results through portals require less staff time for these activities.
Engaged patients also demonstrate better health outcomes. Research shows that patients who actively use portal features have higher medication adherence, better preventive care compliance, and improved chronic disease management.
This metric indicates how well you’re adapting to patient expectations. Younger patients especially expect digital access, and practices that don’t offer it risk losing this demographic to more tech-savvy competitors.
As a digital marketing agency specializing in healthcare, DigifyClinic understands that digital engagement isn’t just about technology. It’s about creating seamless patient experiences that build loyalty and differentiate your practice.
How to Optimize
Make digital enrollment simple and provide multiple enrollment opportunities. Offer sign-up at checkout, through email invitations, and via text message.
Deliver value that motivates usage. If your portal only allows bill payment, patients won’t engage regularly. Add features like prescription refills, test results, appointment scheduling, and secure messaging.
Provide training and support, especially for less tech-savvy patients. Brief demonstrations during appointments and simple how-to guides can dramatically increase adoption.
Promote your digital tools consistently. Staff should mention portal features during every patient interaction, and signage should reinforce the message throughout your facility.
Create digital content that brings patients back to your platforms. Educational articles, health tips, and wellness resources keep your practice top-of-mind between appointments.
Bringing Medical Practice Analytics Together
These seven metrics provide a comprehensive view of your practice’s health. Together, they reveal how efficiently you attract and retain patients, deliver care, generate revenue, and satisfy those you serve.
The key to success isn’t just tracking these numbers. It’s taking action based on what they tell you. Establish baseline measurements, set realistic improvement targets, and regularly review progress toward those goals.
Modern practice management software makes monitoring these metrics dramatically easier than manual tracking. Automated dashboards can display real-time data, alert you to concerning trends, and generate reports that once required hours of manual calculation.
Remember that metrics should drive improvement, not create stress. Start with one or two that address your most pressing challenges. As you develop comfort with data-driven decision-making, expand your analytics program.
Medical practice analytics become even more powerful when combined with strategic digital marketing. DigifyClinic helps healthcare providers connect the dots between data insights and growth strategies, turning metrics into marketing campaigns that attract ideal patients and build thriving practices.
Taking the Next Step
Medical practice analytics transform how you understand and operate your clinic. They replace guesswork with evidence, highlight opportunities you might otherwise miss, and help you build a more successful, sustainable practice.
The practices thriving in today’s competitive healthcare environment share a common characteristic: they make decisions based on data. They know their numbers, understand what drives them, and continuously work to improve performance.
Which of these seven metrics matters most for your practice right now? Identify your biggest challenge, whether it’s patient acquisition, retention, revenue optimization, or operational efficiency, and start measuring the metrics that address it.
The insights you gain will guide better decisions, improve patient care, and strengthen your practice’s financial foundation. In healthcare’s evolving landscape, medical practice analytics aren’t optional luxuries; they’re essential tools for success.
Partner with Healthcare Marketing Experts
Understanding medical practice analytics is just the first step. Translating data into actionable digital marketing strategies requires specialized expertise in the healthcare sector.
DigifyClinic specializes in helping doctors and healthcare brands grow through data-driven digital marketing. We don’t work with just any business. We focus exclusively on healthcare providers because we understand your unique challenges, compliance requirements, and patient acquisition dynamics.
From optimizing your online presence to implementing patient engagement systems that improve these key metrics, our team brings healthcare-specific expertise that general marketing agencies simply can’t match.
Our services help you:
- Attract more patients through targeted digital advertising and SEO strategies
- Improve patient retention with automated engagement campaigns
- Enhance your online reputation through review management and content marketing
- Reduce no-show rates with smart reminder systems and patient communication tools
- Increase digital engagement through user-friendly portals and mobile solutions
- Track performance with comprehensive analytics that measure what matters
Ready to transform your clinic’s performance with expert guidance? Contact DigifyClinic today to discover how our healthcare-focused digital marketing solutions can help you attract more patients, improve retention, and build a thriving practice.
Let’s turn your medical practice analytics into a competitive advantage that drives sustainable growth for your healthcare brand.